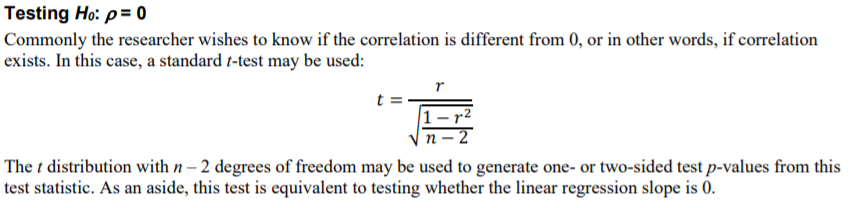
Hypothesis Tests
Correlation作hypothesis test是一个常见的分析,一般我们的零假设H0是ρ=0,也就是说想看下correlation与0的差别是否显著,此时满足t distribution,先计算t-statistics
用R的cor.test函数:
data("iris")
> cor.test(iris$Sepal.Length, iris$Petal.Length)

    Pearson's product-moment correlation

data:  iris$Sepal.Length and iris$Petal.Length
t = 21.646, df = 148, p-value < 2.2e-16
alternative hypothesis: true correlation is not equal to 0
95 percent confidence interval:
 0.8270363 0.9055080
sample estimates:
      cor
0.8717538
公式转化如下:
r <- 0.87175
> r / sqrt((1 - r^2) / (150 - 2))
[1] 21.64563

pvalue <- 2 * pt(-abs(21.64563), df=150-1)
上述两种方式结果一致
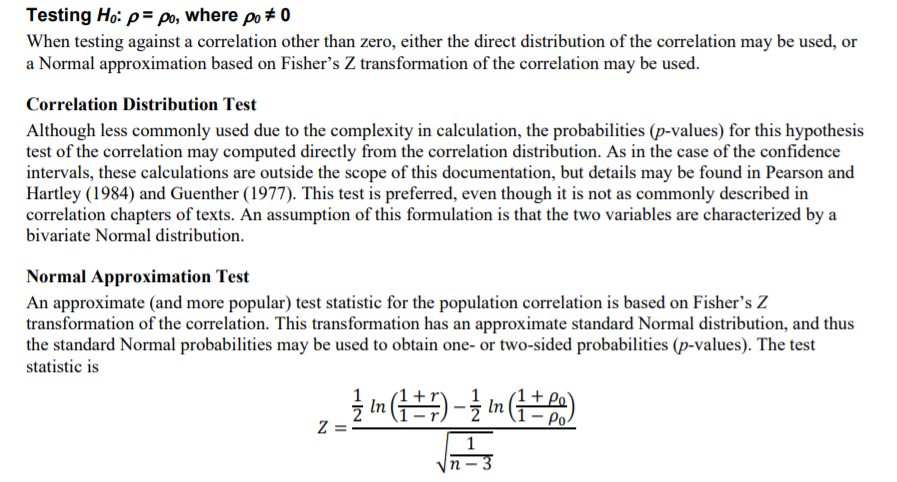
假设我们不想将correlation与0比较,而是跟一个特定的ρ0比较,则需要先将corelation进行Fisher transformation
Fisher transformation有哪些用处呢?
Fisher (1973, p. 199) describes the following practical applications of the z transformation:
- testing whether a population correlation is equal to a given value
- testing for equality of two population correlations
- combining correlation estimates from different samples
这里主要看上述第一条,即given value
接上述iris的例子,假设我想看correlation与ρ0=0.8做比较,则:
> (1/2*log((1+0.87175)/(1-0.87175)) - 1/2*log((1+0.8)/(1-0.8))) / sqrt(1/(150-3))
[1] 2.930596
> 2 * pnorm(abs(2.930596), lower.tail = F)
[1] 0.003383124以上结果与NCSS软件一致,但与SAS的proc corr的结果有些略微不同(主要在于最终的P值)
proc corr data=sashelp.iris nosimple fisher (rho0=0.8 biasadj=no);
    var SepalLength PetalLength;
run;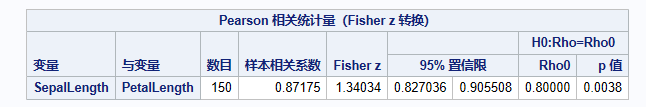
上述SAS的结果中的Fisher z统计量是指
Zρ,而不是Zρ-Zρ0
Confidence Intervals
从上述公式可看出,对于fisher transformation后的Z分布,虽然其不是完全的标准正态分布,但随着样本量的增加可看作近似正态分布:
For the transformed , the approximate variance V(zr)=1/(n-3) is independent of the correlation . Furthermore, even the distribution of is not strictly normal, it tends to normality rapidly as the sample size increases for any values of (Fisher 1973, pp. 200–201).
计算公式如下:
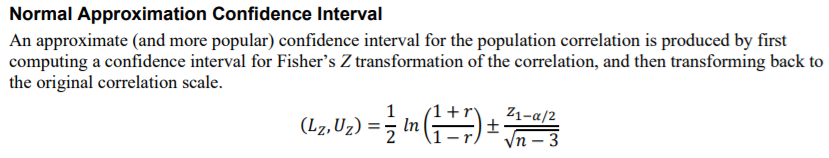
上述结果是转化后Z分布的confidence interval,然后需要再转化为correlation对应的confidence interval

# Correlation coefficient
r <- 0.87175
# Z statistics
Z_upper <- 1/2 * log((1+r)/(1-r)) + qnorm(p = 1 - 0.05/2, lower.tail = T) / sqrt(150 - 3)
Z_lower <- 1/2 * log((1+r)/(1-r)) - qnorm(p = 1 - 0.05/2, lower.tail = T) / sqrt(150 - 3)
# Correlation confidence interval
Cor_upper <- (exp(2 * Z_upper) - 1) / (exp(2 * Z_upper) + 1)
Cor_lower <- (exp(2 * Z_lower) - 1) / (exp(2 * Z_lower) + 1)
> c(Cor_lower, Cor_upper)
[1] 0.8270314 0.9055052上述结果跟R的cor.test和SAS的proc corr结果一致,说明没有问题
以上公式均参考自:
SAS The CORR Procedure
NCSS Correlation
PS. 若想了解其他的correlation hypothesis test方法以及计算结果可参考:https://www.psychometrica.de/correlation.html,蛮有意思的一个网站。。。
其他参考资料:
https://stats.stackexchange.com/questions/14220/how-to-test-hypothesis-that-correlation-is-equal-to-given-value-using-r https://en.wikipedia.org/wiki/Pearson_correlation_coefficient#Fisher_Transformation
https://cran.r-project.org/web/packages/cocor/cocor.pdf
https://www.personality-project.org/r/html/paired.r.html
本文出自于http://www.bioinfo-scrounger.com转载请注明出处