This is reference to the "Chapter 8 A graphical compendium" in <SAS and R: Data Management, Statistical Analysis, and Graphics (second edition)>.
I believe that the capability of data science is more than just building predictive models, data visualization is also an integral part, especially in a convincing way.
从我对SAS的初步接触来看,SAS绘图功能不如R实用和方便;如果仅仅是要满足临床试验中固定化图表的实现,那SAS还是可以的,但是复杂的图表或者更加个性化的图表,那SAS可能就欠佳了,一个主要的原因,我觉得是SAS不是开源的,没有那么多开发者们愿意投入和分享。。。
虽然SAS绘图不是很给力,但是我们还是得学习学习,顺便也看下R中的实现方式,以下整理一些常用的图形绘制方式
Barplot
柱状图,在SAS中使用sgplot和vbar,styleattrs定义group的颜色,barwidth定义柱子宽度,transparency对应透明度,stat定义纵坐标展示的统计量,grid用于增加网格线
/*Barplot*/
proc sgplot data=sashelp.class;
  styleattrs datacolors=(red green);
/*  title "Sex vs. Mean weight.";*/
  vbar sex/response=weight barwidth=0.75 group=sex
    transparency=0.5 stat=mean;
  yaxis grid;
run;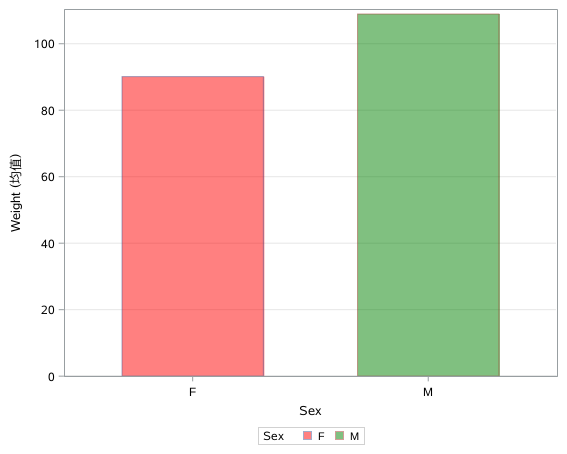
若想增加error bars,则增加limits=both参数
**** Barplot with errorbar;
proc sgplot data=sashelp.cars;
  vbar type/response=msrp stat=mean limitstat=stddev limits=both;
run;若想绘制堆积图,则增加groupdisplay=stack参数,还可以配合stat=percent以及categoryorder等等
**** Stacked barplot, forcing on groupdisplay param;
proc sgplot data=sashelp.cars(where=(Type="SUV"));
  vbar Type / Group=Origin groupdisplay=stack stat=percent categoryorder=respdesc;
run;若想绘制分组型的直方图,则增加group和groupdisplay=cluster参数
**** Barplot by groups, the groupdisplay=cluster;
proc sgplot data=sashelp.cars;
  vbar origin/group=DriveTrain groupdisplay=cluster;
run;
若在分组型的直方图中将纵坐标改成percent,则:
/*Define the percent is within group, not all*/
proc sgplot data=sashelp.cars pctlevel=group;
  vbar origin/group=DriveTrain groupdisplay=cluster stat=percent;
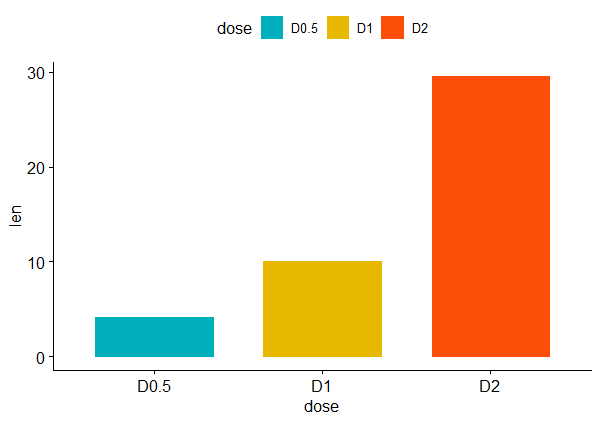
run;在R中,base函数是用barplot(),或者使用绘图包,如ggplot2包中的ggplot2::geom_bar(),以及ggpubr包的ggpubr::ggbarplot();若想寻找R的barplot()函数能绘制哪些图形,可试下输入example(barplot),如是ggplot2和ggpubr的资源,则可以查阅以下reference
https://rpkgs.datanovia.com/ggpubr/reference/index.html
ggbarplot(df, "dose", "len", fill = "dose", color = "dose", palette = c("#00AFBB", "#E7B800", "#FC4E07"))
接着那么在SAS中导出/保存生成的图片, ods指定保存的位置及图片类型及命名(注:若不想在fillattrs中自定义color和transparency,则直接定义fillattrs=GraphData2)
ods _all_ close;
ods listing gpath="C:\Plots";
ods graphics / imagename="barplot" imagefmt=png height=10cm width=15cm;
proc sgplot data=sashelp.class;
  vbar sex/response=weight barwidth=0.5 fillattrs=(color=skyblue)
    transparency=0.5 stat=mean;
  yaxis grid;
run;
ods listing close;
若想输出到RTF中(对于出报告,这真是SAS的强项。。。特别是样式标准化的报告),则增加ods rtf来指定输出方式及路径,ods graphics / noborder定义输出的图形不要边框
ods _all_ close;
ods rtf file="C:\Plots\barplot.rtf";
ods graphics / noborder;
ods graphics /outputfmt=JPEG;
ods escapechar="^";
options nodate nonumber pageno=1;
proc sgplot data=sashelp.class;
  vbar sex/response=weight barwidth=0.5 fillattrs=GraphData2
    transparency=0.5 stat=mean;
  yaxis grid;
run;
ods rtf close;
Dotplot
SAS中的dotplot跟R的有点不同,其X轴只支持数值型的变量(这点不确定是否有误),然后的有相应的stat参数才行;这样的话,那跟散点图有啥区别,我更想是X轴是分类变量。。。下面是SAS中带有误差线的dotplot,X轴是Height的均值;若想分组(如颜色形状等等),则增加group variable
proc sgplot data=sashelp.class;
  dot Age / response=Height stat=mean
            limitstat=stddev numstd=1;
run;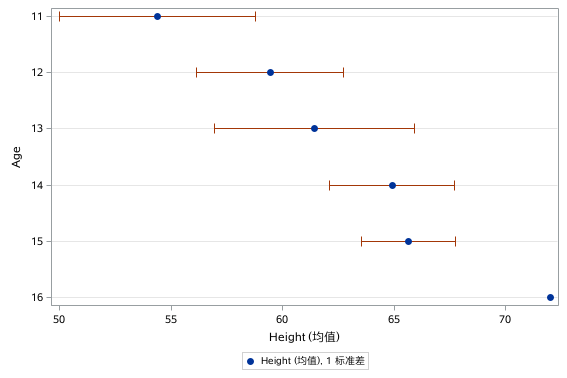
在R中,dotplot一般用于X轴是分类变量的情况,可用ggpubr包的ggdotplot()函数,其中add = "boxplot"参数用于在dotplot中增加boxplot,如下所示:
library(ggpubr)
ggdotplot(ToothGrowth, "dose", "len",
          add = "boxplot",
          color = "dose", fill = "dose",
          palette = c("#00AFBB", "#E7B800", "#FC4E07"))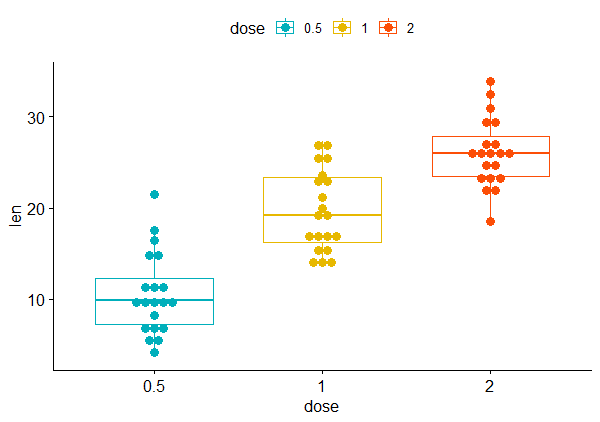
若SAS中想呈现处boxplot和dotplot合并的形式,则需要同时使用vbox和scatter,并增加jitter实现抖动效果以免重叠
proc sgplot data=sashelp.cars;
  vbox MPG_City / category=Cylinders boxwidth=0.5 nooutliers;
  scatter x=Cylinders y=MPG_City / jitter
     transparency=0.6 markerattrs=(color=red symbol=CircleFilled);
run;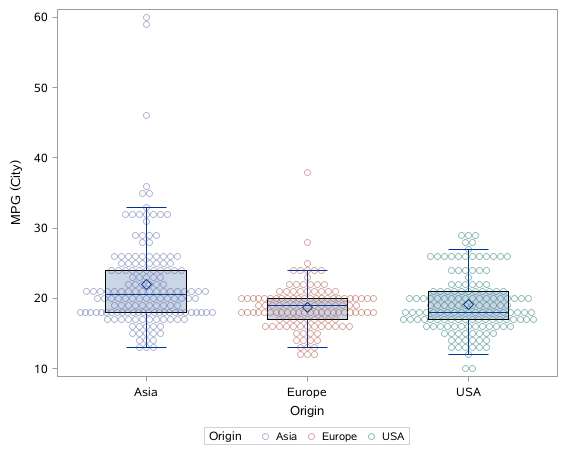
Histogram
直方图,一般用于看数据分布情况,SAS用法如下所示:
proc sgplot data=sashelp.cars;
  histogram MPG_City / nbins=30;
  xaxis values=(0 to 70 by 10);
  density MPG_City;
run;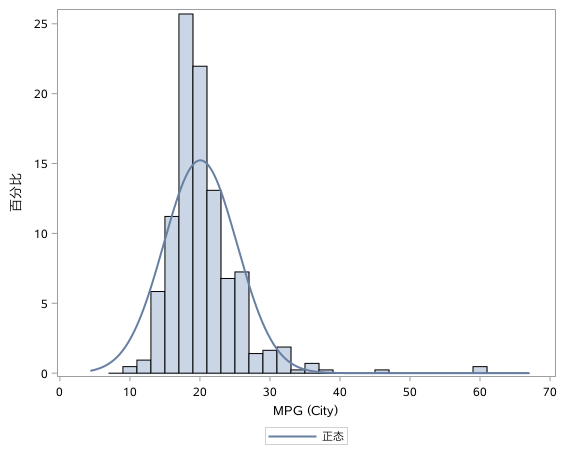
若想将多组直方图overlap,则增加group参数
**** overlapping histogram by two columns;
proc sgplot data=sashelp.cars;
  histogram MPG_City / binstart=0 binwidth=2 transparency=0.5;
  histogram MPG_Highway / binstart=0 binwidth=2 transparency=0.5;
run;而在R中,base函数hist(),或者ggplot2包以及ggpubr包都能实现,如:
wdata = data.frame(
   sex = factor(rep(c("F", "M"), each=200)),
   weight = c(rnorm(200, 55), rnorm(200, 58)))
gghistogram(wdata, x = "weight", y = "..density..",
            add = "mean", rug = TRUE,
            fill = "sex", palette = "jco",
            add_density = TRUE)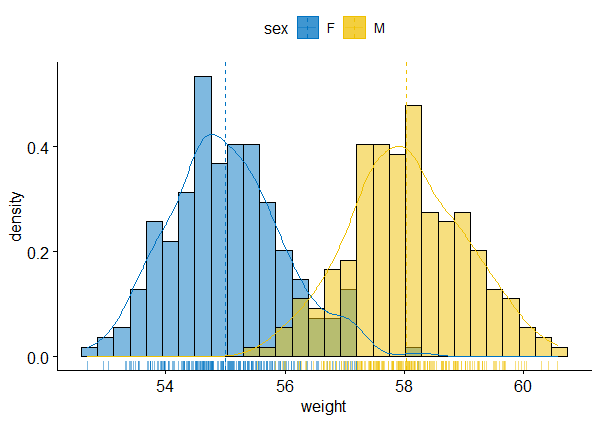
Boxplot
箱线图,不仅可看数据分布情况,还可以看是否有潜在的离群点,适用性比较广,展现的灵活性也比较高,非常常用;在SAS,我还是以sgplot的vbox语句举例,如下所示:
proc sgplot data=sashelp.heart;
  vbox Cholesterol / category=DeathCause
    group=Sex clusterwidth=0.5
    boxwidth=0.8 meanattrs=(size=5)
    outlierattrs=(size=5);
  xaxis display=(noline nolabel noticks);
  yaxis display=(noline nolabel noticks);
run;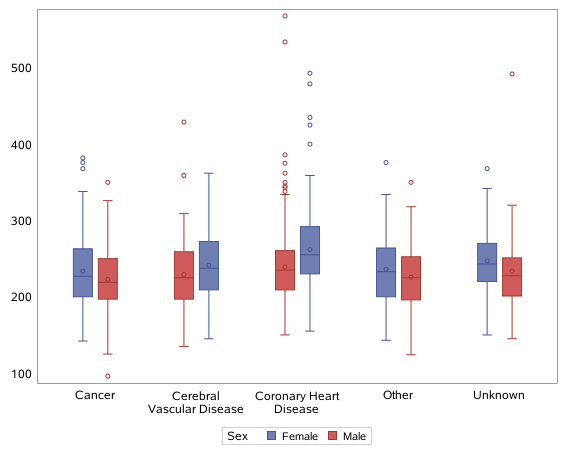
在R中的话,想生成上图的形式,可用ggplot2包或者ggpubr包,如下ggpubr::ggboxplot()函数所示,其中palette = "jco"是指调用JCO期刊的色板,这个是ggpubr包的一个极好的功能,特别实用。。。
ggboxplot(ToothGrowth, "dose", "len", fill = "supp", palette = "jco", bxp.errorbar = T)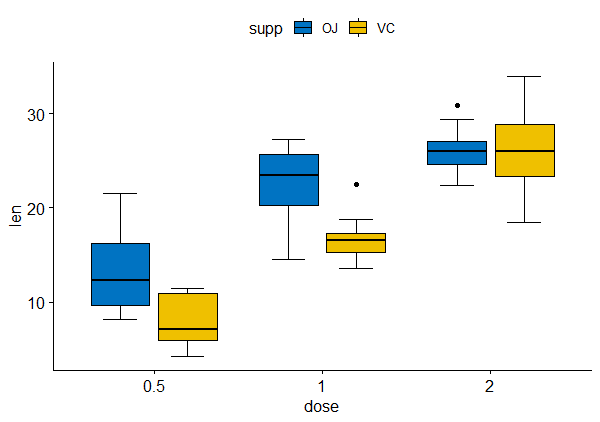
Bubble plot
气泡图,SAS可以用sgplot下的bubble语句,如:
proc sgplot data=sashelp.cars;
  bubble x=Horsepower y=MPG_Highway size=Cylinders;
run;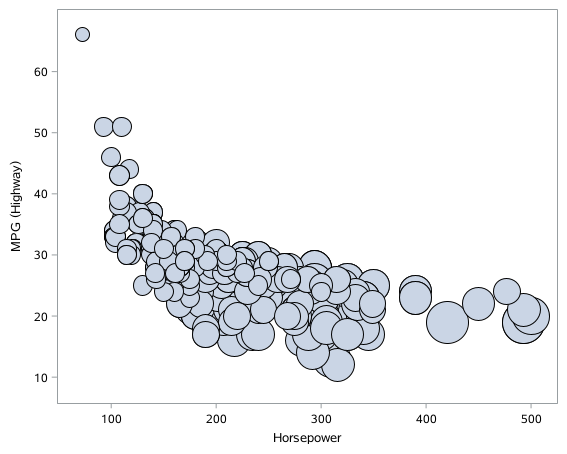
在R中,则可以用ggplot包的geom_point()函数,类似于散点图
Scatter plots
散点图,应用及其广泛的一种展示形式,一般会搭配拟合曲线等其他信息一起展示,在SAS中则是用sgplot下的scatter语句;其中attrpriority=none有点意思,假如是等于none,则除了有color of markers and lines外,line patterns or marker symbols都跟随group变量;但假如是等于color,则只有color of markers and lines跟随group变量
ods graphics on / border=off attrpriority=none height=12cm width=15cm;
proc sgplot data=sashelp.iris;
  styleattrs datacontrastcolors=(magenta orange brown) datasymbols=(star square triangle);
  scatter x=PetalLength y=PetalWidth / group=Species;
  reg x=PetalLength y=PetalWidth / group=Species clm;
run;
ods graphics off;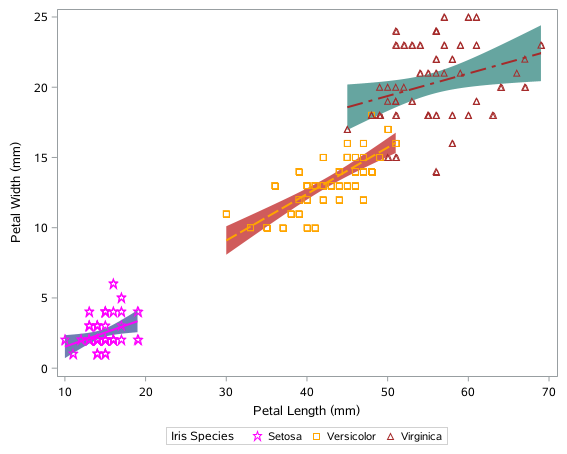
若想增加prediction limits(预测的置信区间)和confidence limits(总体均数的置信区间),则分别增加cli和clm参数
在R中,若想实现上述这张图的效果,则可以用ggplot包的ggscatter()函数
ggscatter(iris, x = "Petal.Length", y = "Petal.Width",
          color = "Species", shape = "Species",
          add.params = list(linetype = "Species"),
          add = "reg.line", conf.int = T)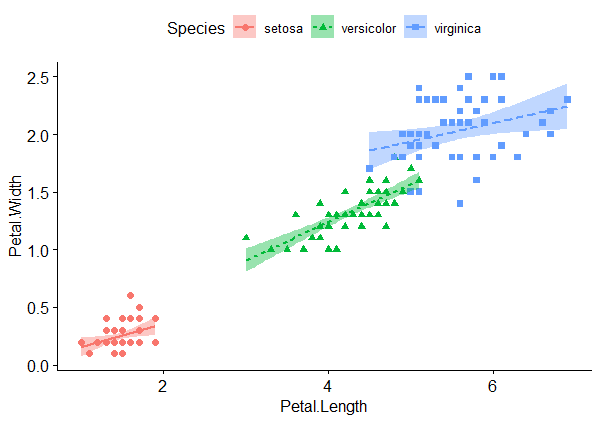
Matrix scatter plots
矩阵散点图,一个快速展示数据整体分布情况的图,特别是需要多个变量之间两两展示的是时候
在SAS中,是用matrix语句实现
**** Matrix scatter plots;
proc sgscatter data=sashelp.cars;
  matrix MPG_Highway Horsepower EngineSize / diagonal=(histogram normal);
run;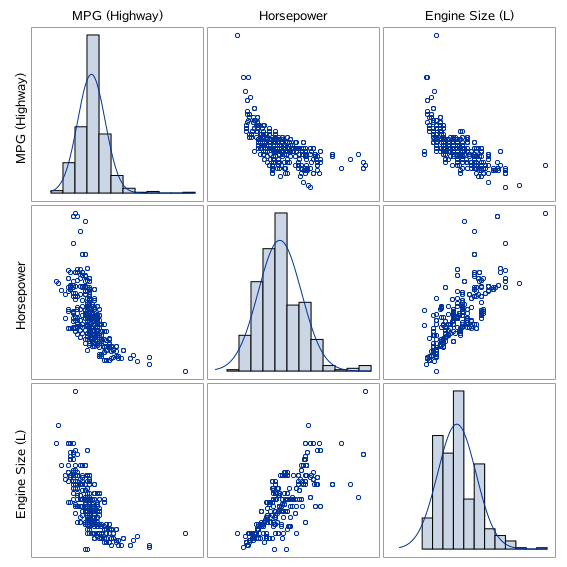
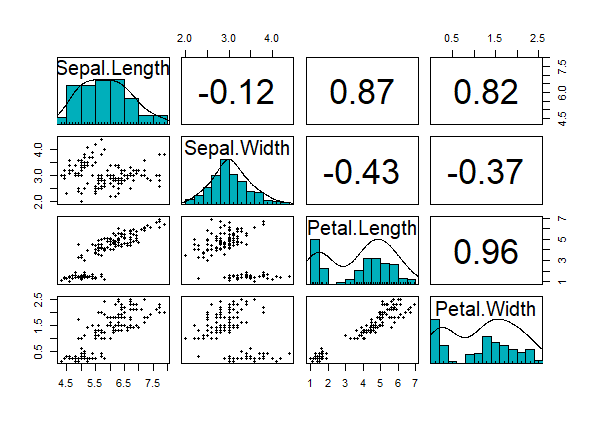
在R中,如果是简单的矩阵散点图,可以直接对矩阵数据类型调用plot()函数,如:
plot(iris[,-5] , pch=20 , cex=1.5)或者用pairs()函数
pairs(iris[,-5])假如想跟SAS一样在对角线有直方图,则需要使用psych包的pairs.panels()函数,如:
psych::pairs.panels(
  iris[,-5],
  method = "pearson", # correlation method
  hist.col = "#00AFBB",
  density = TRUE,  # show density plots
  ellipses = FALSE, # show correlation ellipses
  smooth = FALSE
)
Line plot
常用的是点线图,然后分组以及带有error bar,SAS如下所示:
**** Line plot with errorbar in different groups;
proc sgplot data=sashelp.cars;
  vline Cylinders/response=msrp stat=mean group=type limits=both limitstat=stddev markers;
run;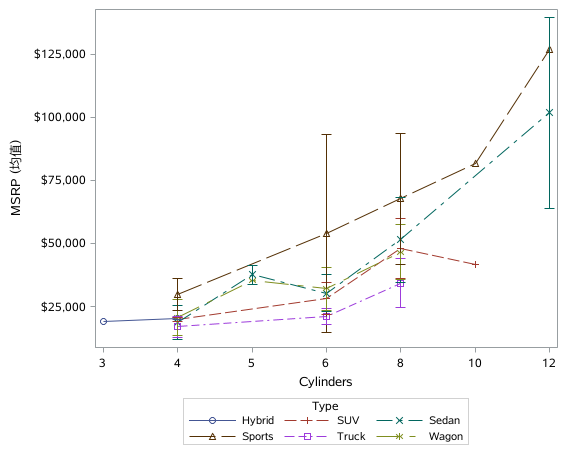
如果是R的话,可以用ggplot包的ggline()函数
ggline(ToothGrowth, x = "dose", y = "len", color = "supp", linetype = "supp",
   add = "mean_se", palette = c("#00AFBB", "#E7B800"))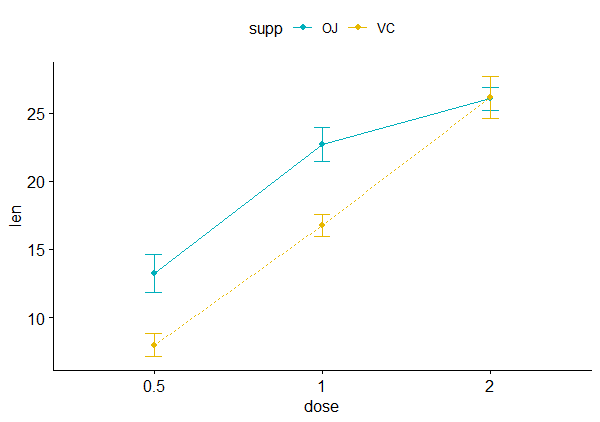
Receiver operating characteristic (ROC) curve
ROC曲线图,在诊断试验中比较常见,在SAS中简单的方法则是直接用logistic语句的plots选项实现;或者导出sensitivity and specificity数据,然后用series语句绘制
ods graphics on;
proc logistic data=sashelp.heart plots(only)=roc;
  class sex Chol_Status BP_Status Weight_Status Smoking_Status;
  model status(event="Dead")=AgeAtStart sex Chol_Status BP_Status Weight_Status Smoking_Status;
  ods output roccurve=ROCdata;
run;
ods graphics off;

** Or use sgplot procedure;
ods graphics on / border=off height=12cm width=15cm;
proc sgplot data=ROCdata aspect=1;
  xaxis label="False Positive Fraction" values=(0 to 1 by 0.25) grid offsetmin=.05 offsetmax=.05;
  yaxis label="True Positive Fraction" values=(0 to 1 by 0.25) grid offsetmin=.05 offsetmax=.05;
  lineparm x=0 y=0 slope=1 / transparency=.3 lineattrs=(color=gray);
  series x=_1mspec_ y=_sensit_ ;
  inset ("Group 1 AUC" = "0.6891") / border opaque position=bottomright;
  title "ROC curves for both groups";
run;
ods graphics off;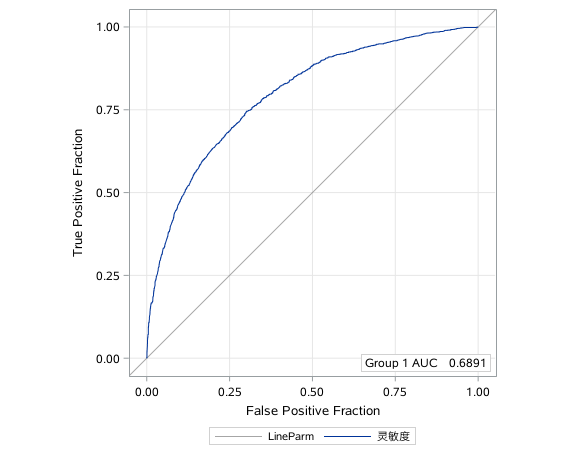
在R中,有多个常见的R包可以计算AUC值及绘制ROC曲线,如pROC,ROCRd等等,但是我总觉得的ROC曲线还是得用ggplot2来绘制,以及搭配plotROC包
Kaplan-Meier plot
生存分析中Kaplan-Meier中用于展现患者生存过程的重要手段,在SAS中简单的方法则是直接用lifetest语句的plots选项实现;或者导出生存数据,然后用series语句绘制
**** Kaplan-Meier plot;
proc lifetest data=sashelp.bmt plots=survival;
  time t*status(0);
  strata Group;
run;

** or Failure probability;
proc lifetest data=sashelp.bmt plots=survival(failture);
  time t*status(0);
  strata Group;
run;在R中,我最常用的生存分析的R包是survival和survminer,前者分析后者可视化,真是非常好用。。。
参考资料:
SAS and R: Data Management, Statistical Analysis, and Graphics (second edition)
本文出自于http://www.bioinfo-scrounger.com转载请注明出处