偶尔在查阅资料的时候发现一种动态排名条形图(bar chart race),最初应该是在别人展示各国GDP的时候见过,我查了下,其是用Flourish完成的,我正好用其来可视化Covid-19全球疫情数据
数据来源跟这篇博文一样,是github上实时更新的数据,读取简便(不用爬虫),下面以确诊数据为例
library(dplyr)
library(countrycode)
library(tidyr)

data <- data.table::fread(url_comfirmed_global) %>%
  rename(Province_State = `Province/State`, Country_Region = `Country/Region`) %>%
  group_by(Country_Region) %>%
  summarise_at((5 - 1):(ncol(.) - 1), sum)
并通过转化生成一个每日新增确诊人数数据集
data_newcase <- plyr::ddply(data, "Country_Region", function(x) {
  diff(c(0, as.numeric(x[2:ncol(x)])))
})
names(data_newcase)[2:ncol(data_newcase)] <- colnames(data)[2:ncol(data)]
我取前20个最多确诊的国家,减少数据量
top20_country <- data %>%
  mutate(Total = .[[ncol(.)]]) %>%
  arrange(desc(Total)) %>%
  head(15) %>%
.$Country_Region以下我输出两个文件,Covid19-comfirmed.txt代表每日确诊总人数,Covid19-comfirmed_and_newcase.txt代表每日确诊新增人数;并且为了可视化美观,通过https://www.countryflags.io/#body增加了各国国旗logo
#-------------------------------------------------
# Total comfirmed number of top20 countries
country_comfirmed_df <- data %>%
  filter(Country_Region %in% top20_country) %>%
  mutate(Code = countrycode(Country_Region, origin = "country.name", destination = "iso2c"),
         URL = paste0("https://www.countryflags.io/", tolower(Code), "/flat/64.png")) %>%
  select(c(1, ncol(.)-1, ncol(.), 2:(ncol(.)-2)))

write.table(country_comfirmed_df, file = "../Desktop/Covid19-comfirmed.txt", sep = "\t", col.names = T, row.names = F, quote = F)


#------------------------------------------------
# Total newcase and comfirmed number of top20 countries

data_comfirmed_newcase <- left_join(gather(data, "year", "comfirm", colnames(data)[2:ncol(data)]),
                                    gather(data_newcase, "year", "newcase", colnames(data_newcase)[2:ncol(data_newcase)])) %>%
  filter(Country_Region %in% top20_country) %>%
  mutate(Code = countrycode(Country_Region, origin = "country.name", destination = "iso2c"),
         URL = paste0("https://www.countryflags.io/", tolower(Code), "/flat/64.png"))

write.table(data_comfirmed_newcase, file = "../Desktop/Covid19-comfirmed_and_newcase.txt", sep = "\t", col.names = T, row.names = F, quote = F)
Flourish操作很简单,网页工具,有很友好的引导机制,跟着示例数据操作一遍即可上手,比如我以每日确诊总人数作为数据源,导入到Bar chart race工具中即可生成我们所想要的动态排名条形图,可点击链接查看:https://public.flourish.studio/visualisation/2149838/
接着我们可以试下导入Line chart race工具中,生成线条型的动态排名变化图,可点击链接查看:https://public.flourish.studio/visualisation/2298572/
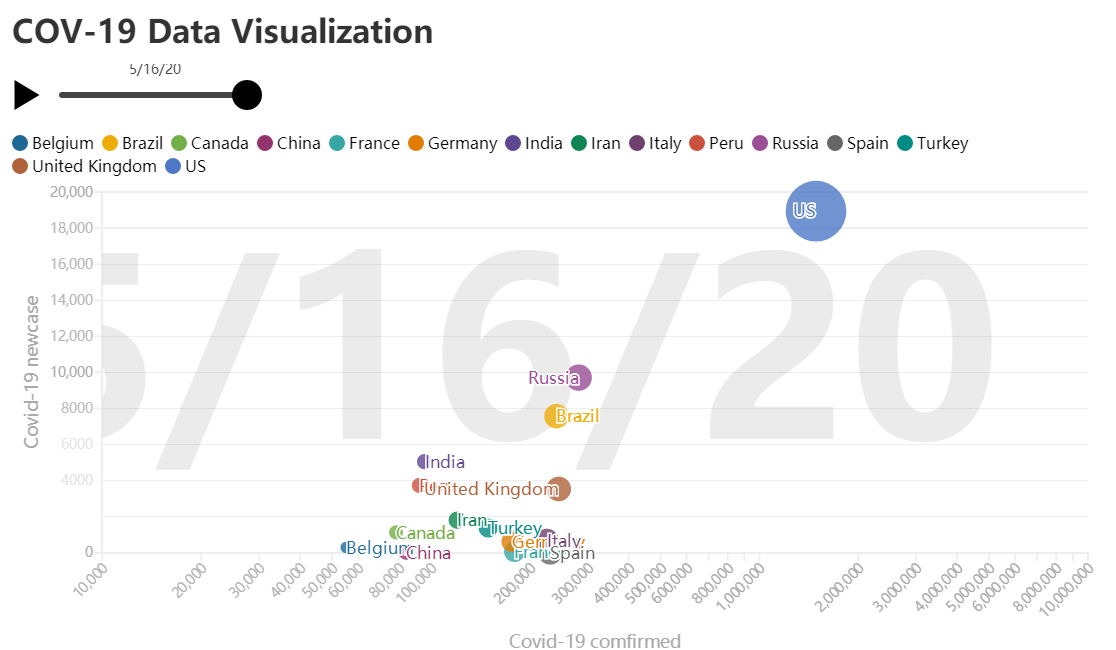
最后我们用Flourish的Bubble chart来生成一个常见的气泡图,数据则用每日新增确诊人数作为纵坐标,每日确诊总人数为横坐标,可点击链接查看:https://public.flourish.studio/visualisation/2151764/
Flourish是一个蛮好用的工具,复杂的功能需要收费哈
本文出自于http://www.bioinfo-scrounger.com转载请注明出处